Pulse Pressure Variation on VA ECMO:
Insights from the Reservoir-Wave Model

A 48-year-old man suffered an in-hospital cardiac arrest due to refractory ventricular arrhythmias. After 22 minutes of cardiopulmonary resuscitation (CPR), he was intubated and urgently established on peripheral veno-arterial extracorporeal membrane oxygenation (VA ECMO) at 4.6 L/min of ECMO flow.

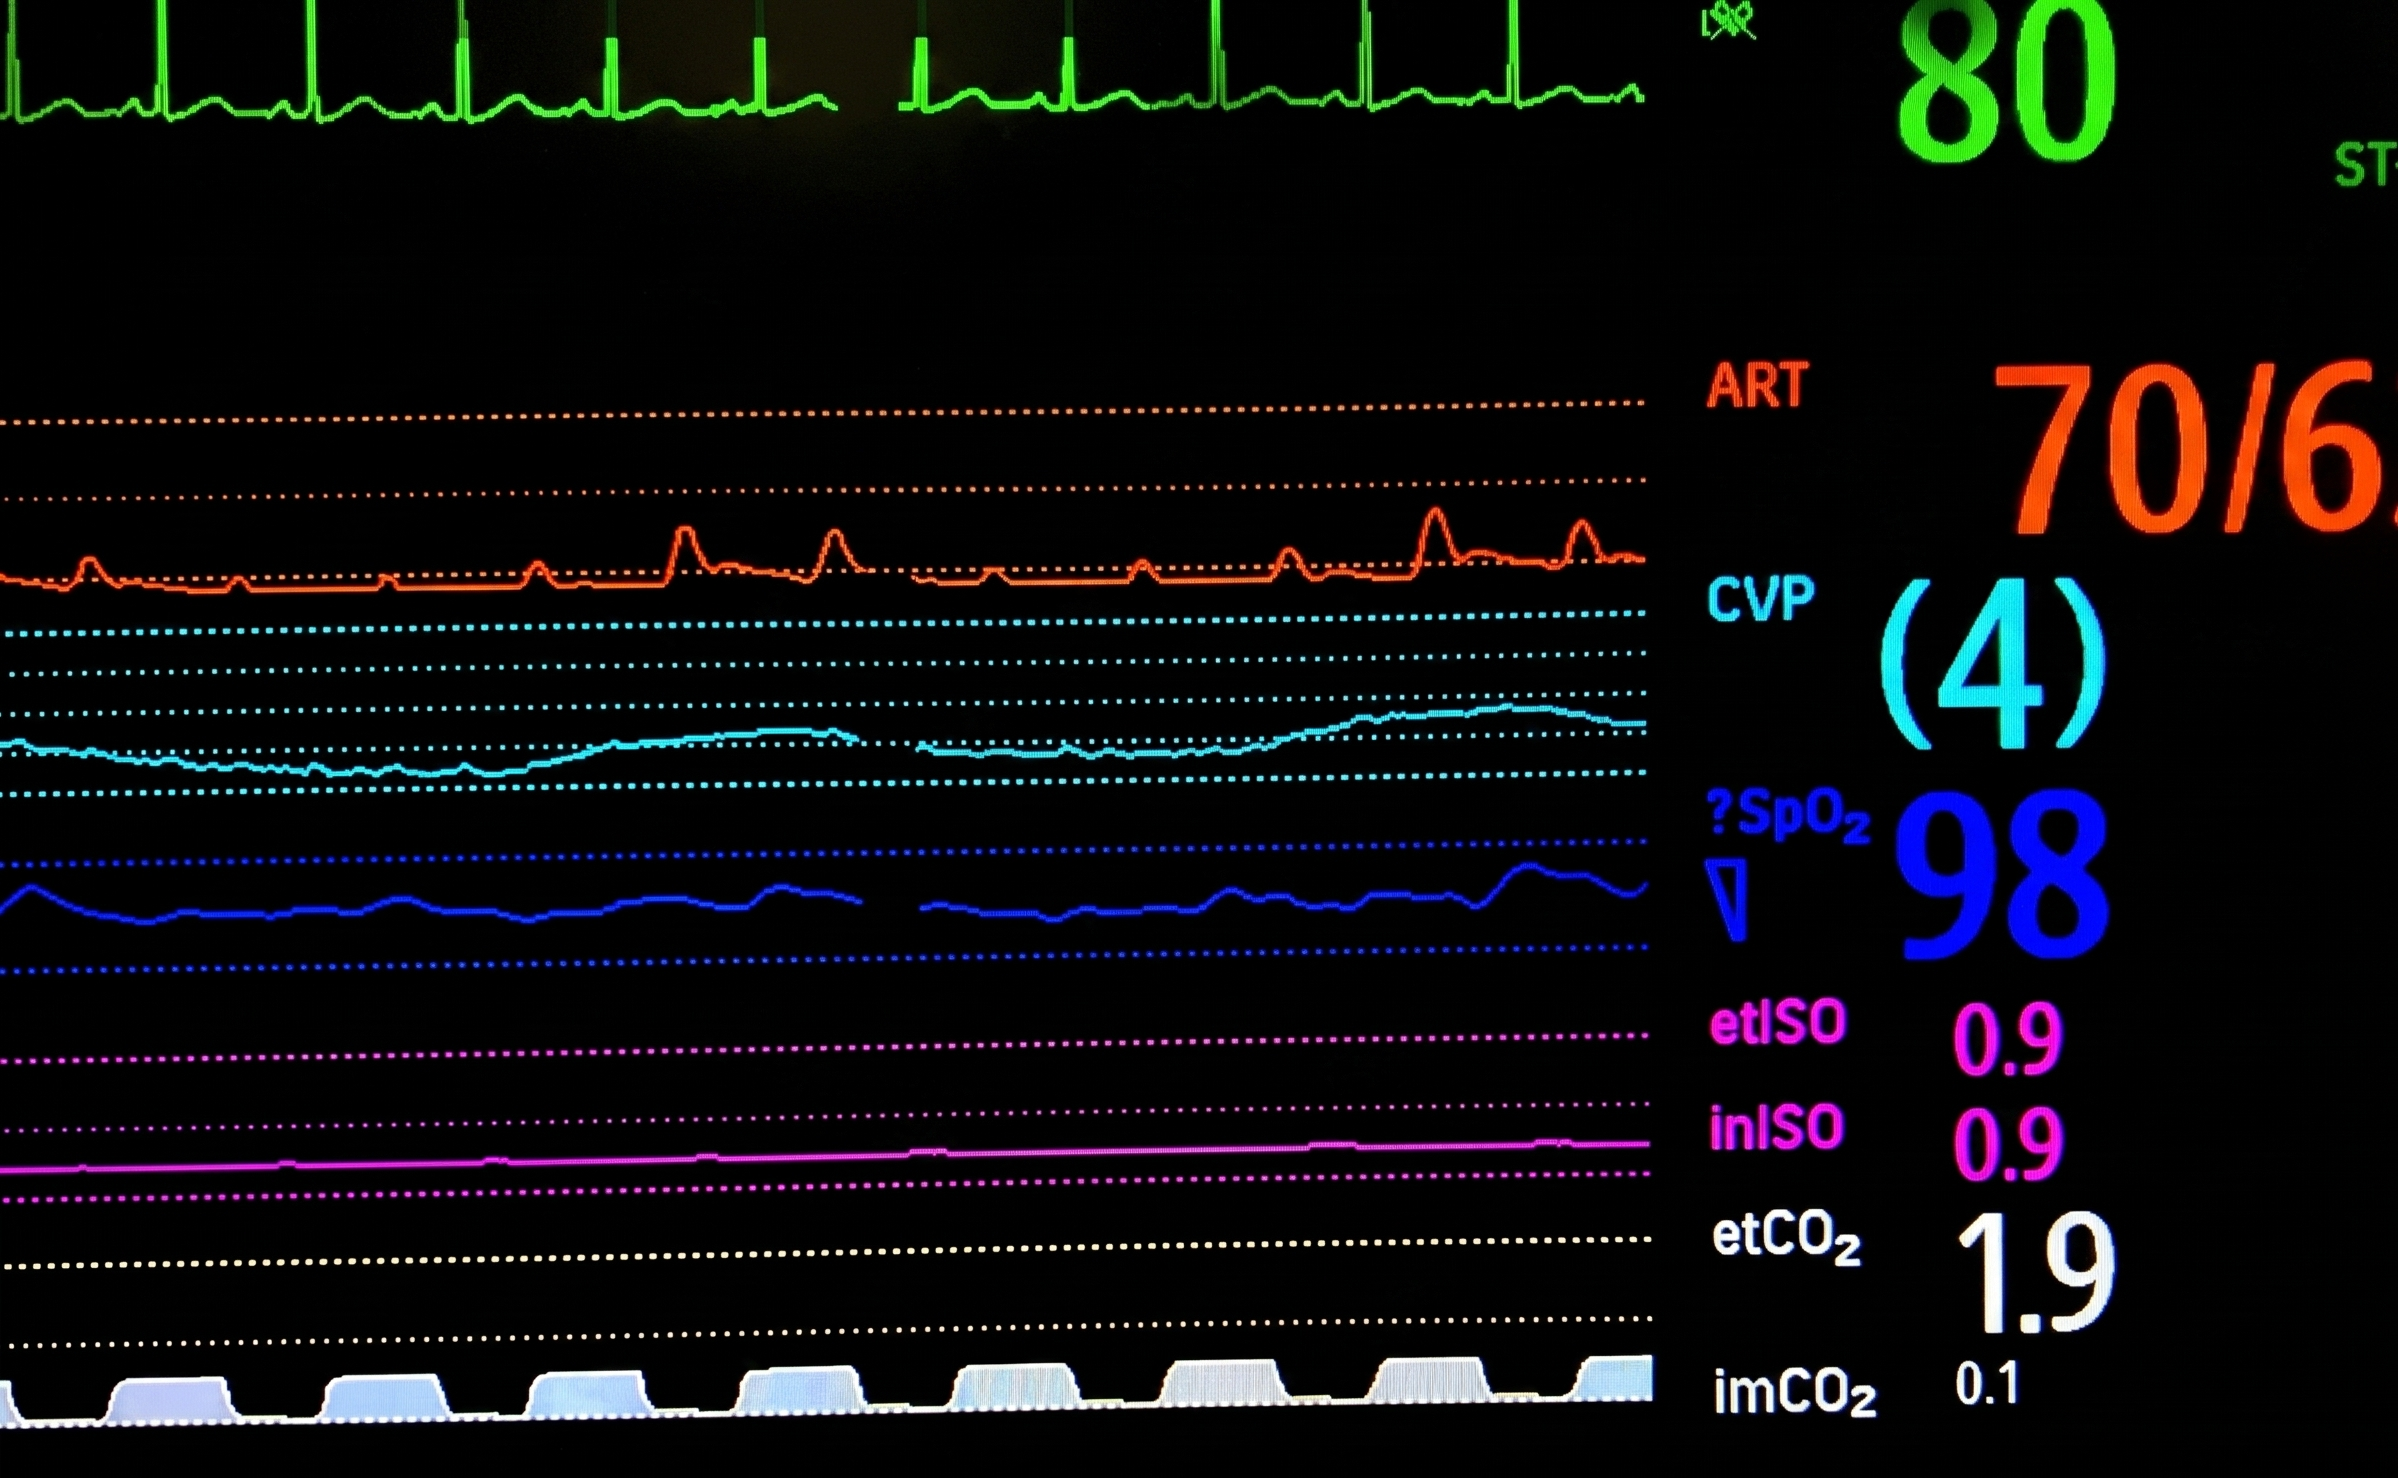
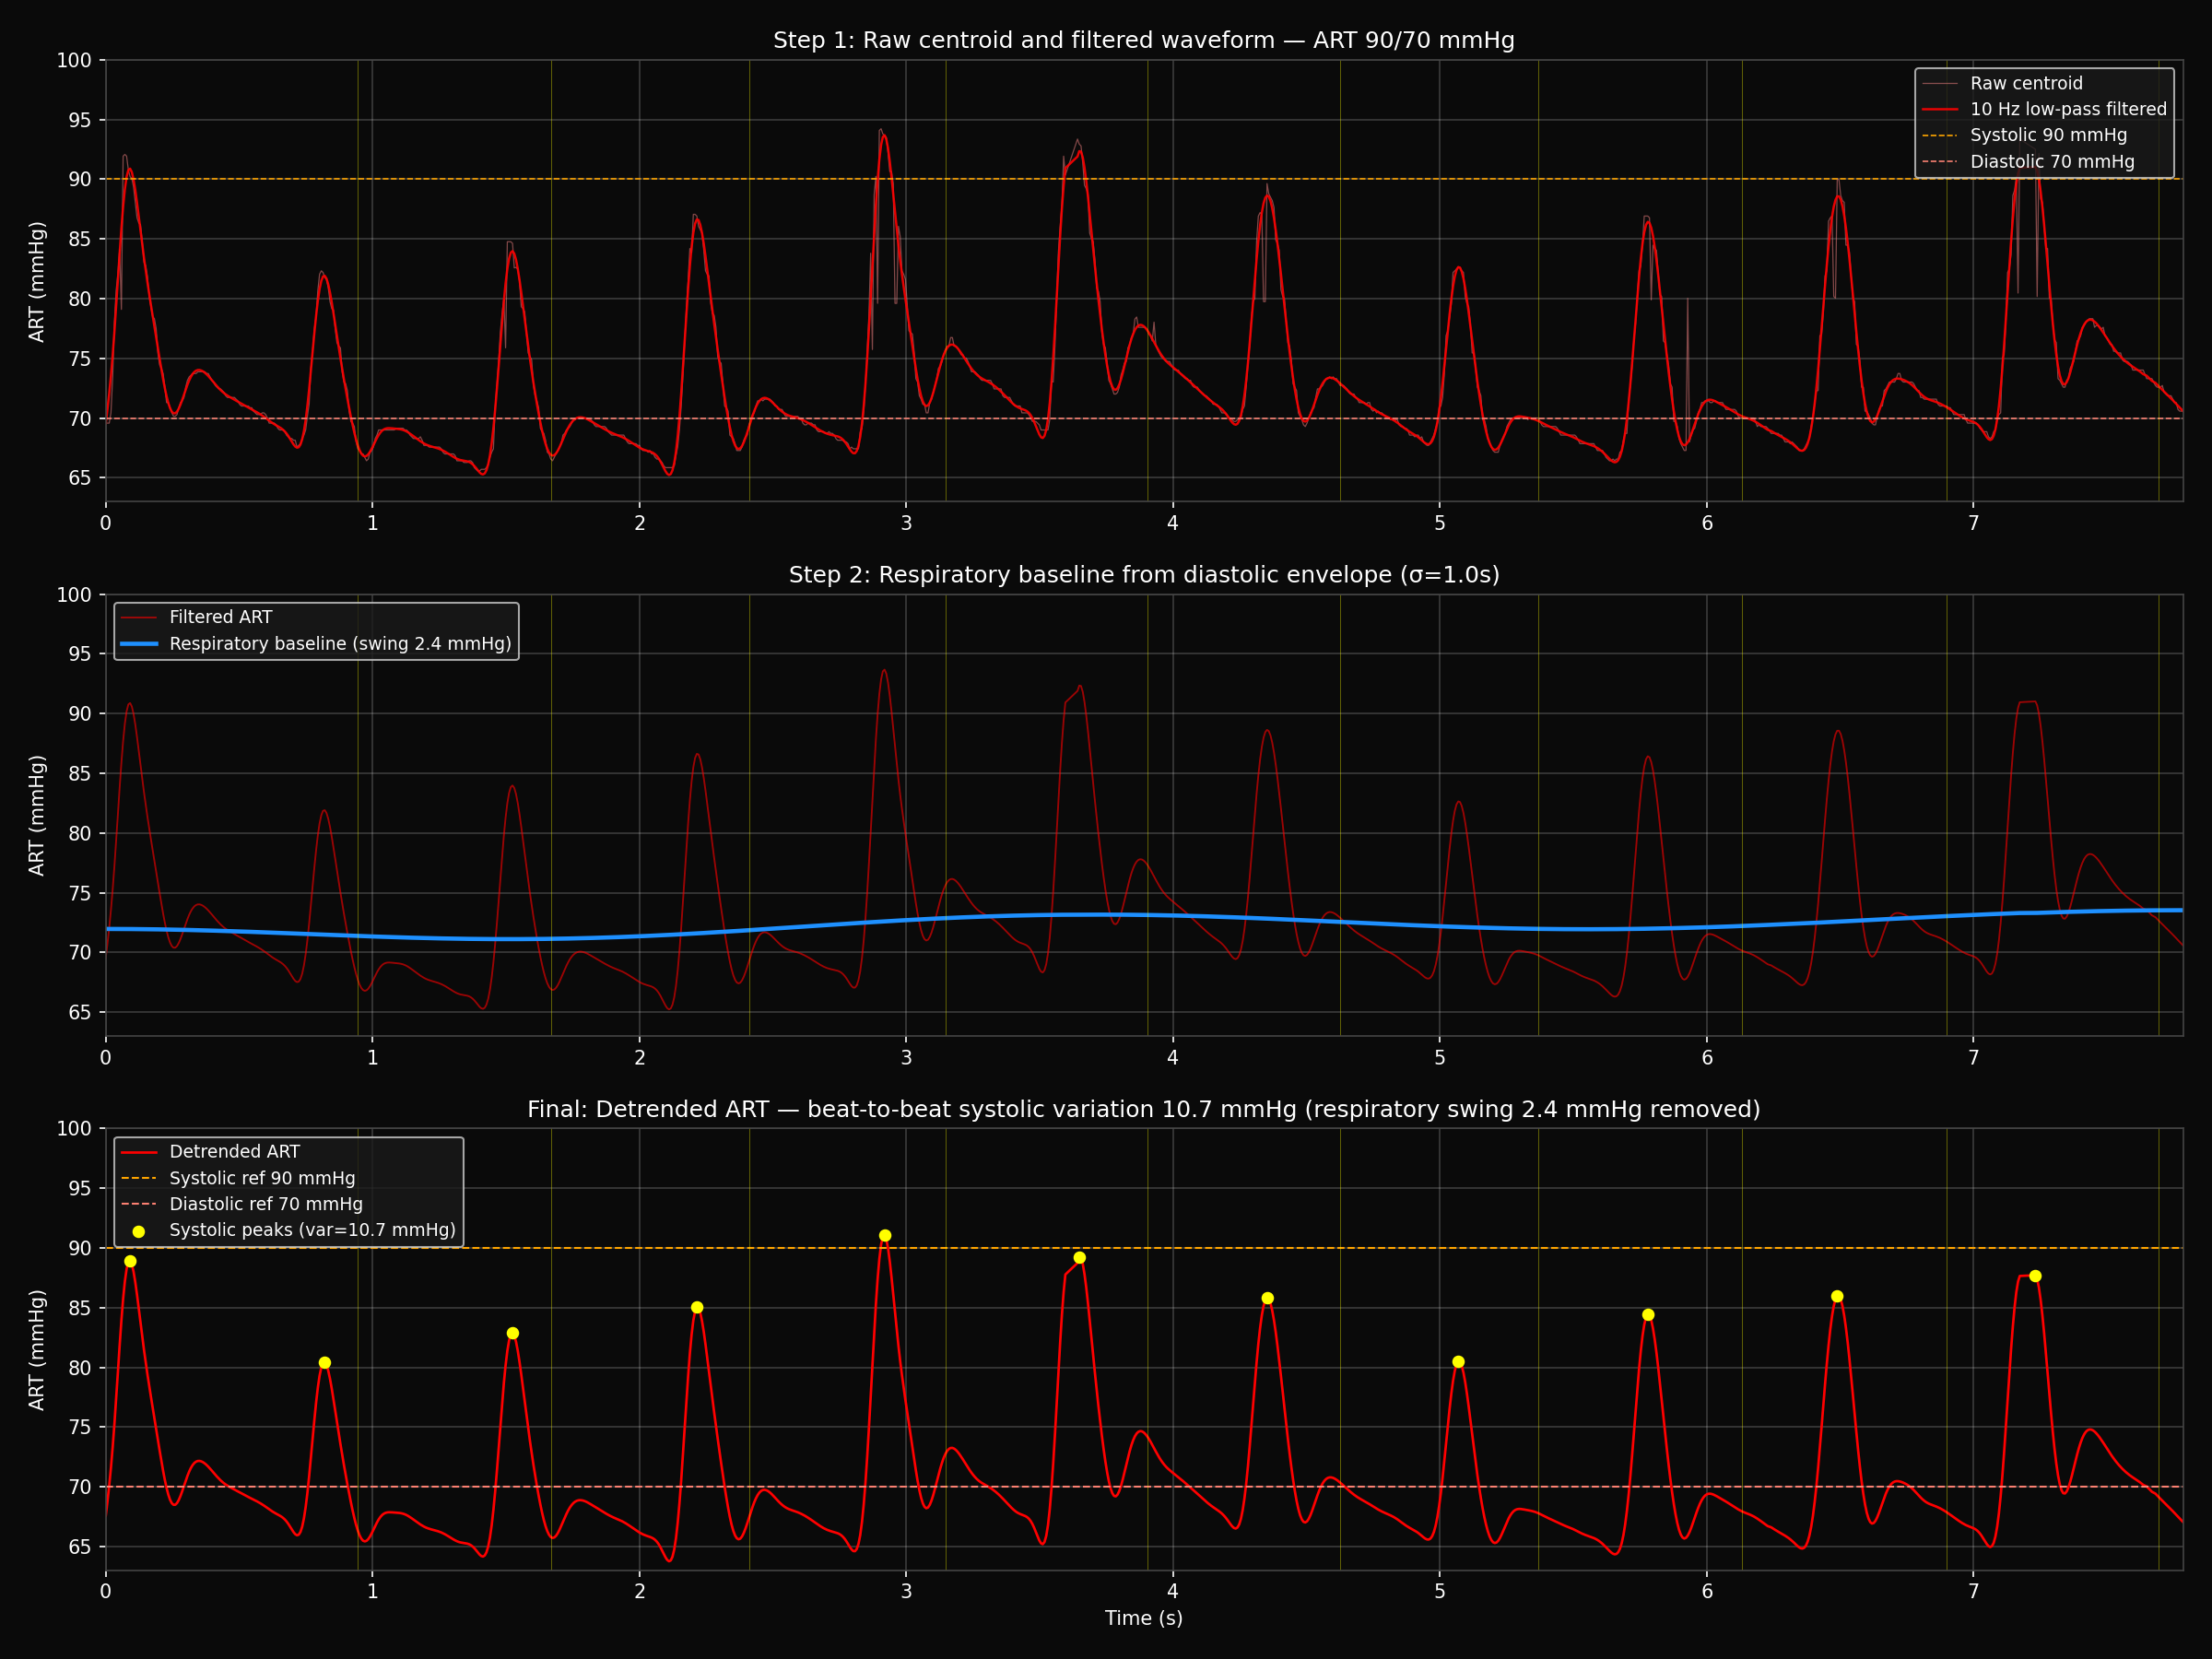
On transfer to the Intensive Care Unit, arterial blood pressure was monitored from the right brachial artery catheter. The bedside Philips IntelliVue monitor displayed narrow pulse pressure (PP = 2.5 ± 1.5 mmHg) and marked pulse pressure variation (PPV) during mechanical ventilation at a tidal volume of 430 mL (6 mL/kg) [Figure (a)].

Transthoracic echocardiography confirmed severe left ventricular systolic impairment (estimated left ventricular ejection fraction ~10%), and no pericardial tamponade. The clinical question: was the narrow pulse pressure and PPV the result of afterload mismatch in a failing ventricle, or volume-responsive hypovolemia?

The Diagnostic Volume Challenge: One unit of packed red blood cells and 500 mL of Hartmann’s solution were infused rapidly over 15 minutes, without changes in ventilator parameters, vasoactive medications (norepinephrine at 0.12 mcg/kg/min), and VA ECMO flow.

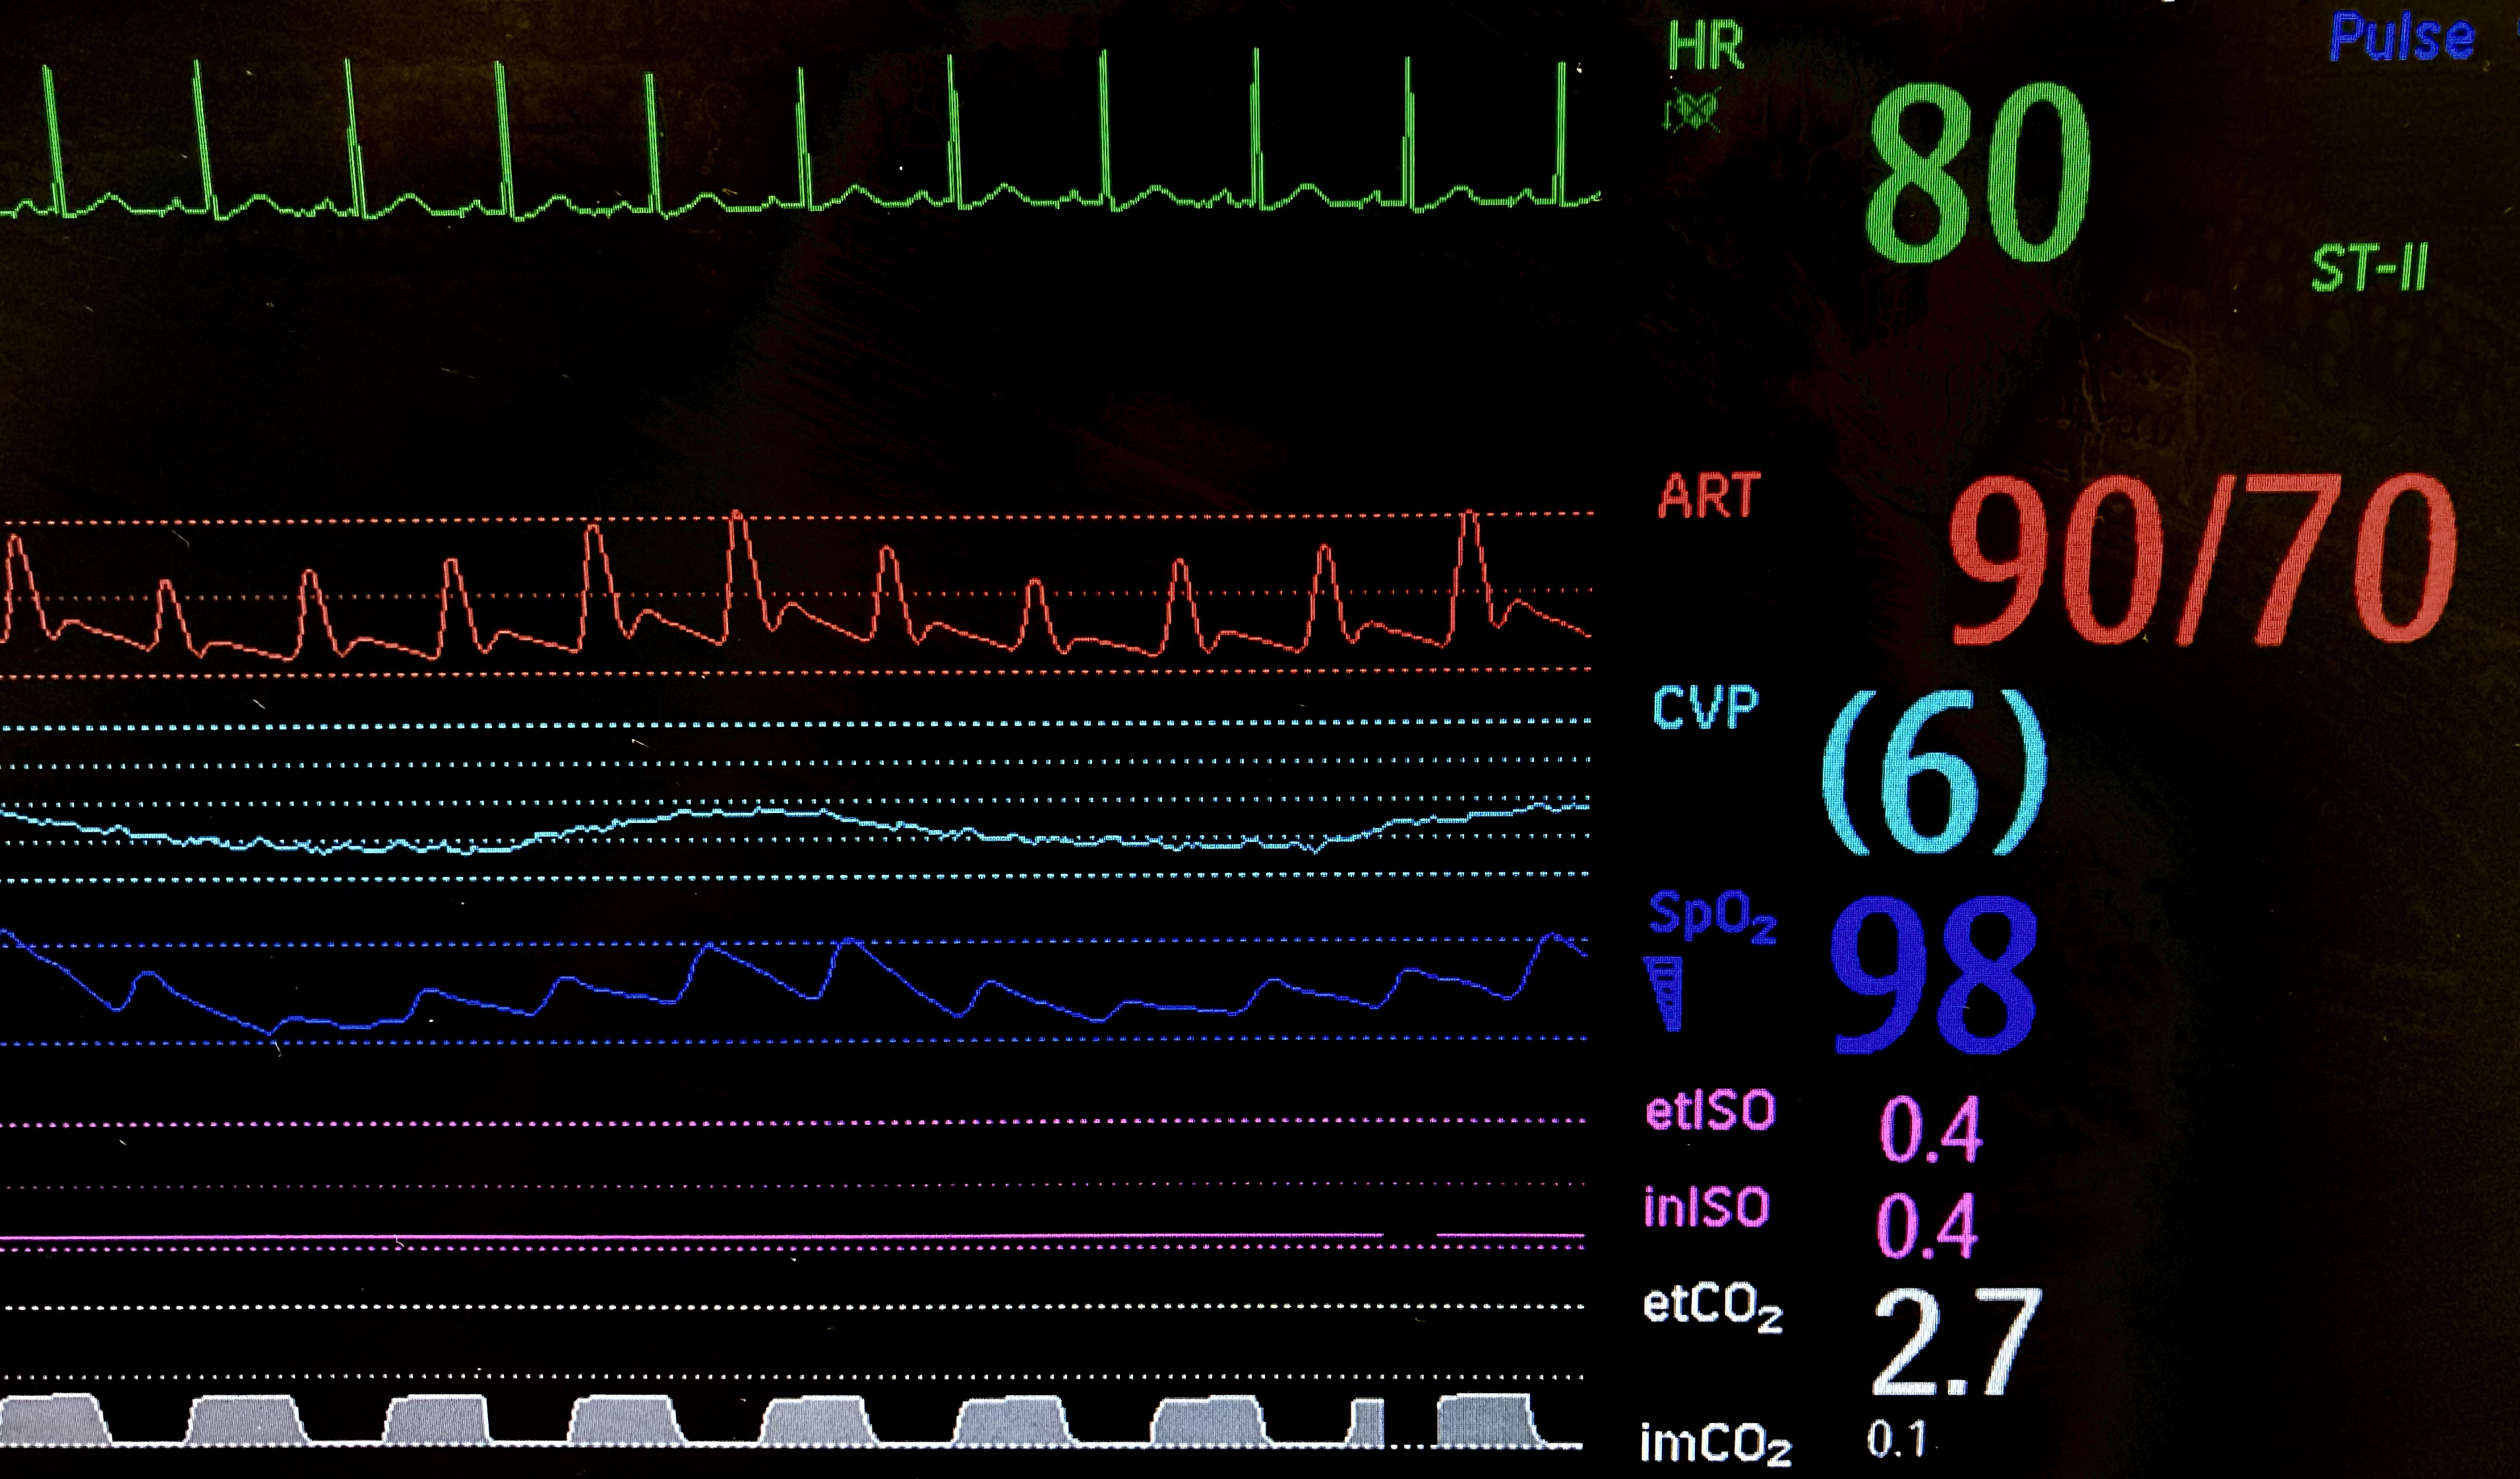
The response: central venous pressure rose, systemic blood pressure increased from 64/62 to 85/65 mmHg (PP expanded eight-fold to 20.1 ± 3.5 mmHg), end-tidal carbon dioxide (ETCO2) increased from 1.9 to 2.7 kPa (confirming augmented transpulmonary blood flow and native LV stroke volume ejection), and respiratory PPV was suppressed [Figure (b)].

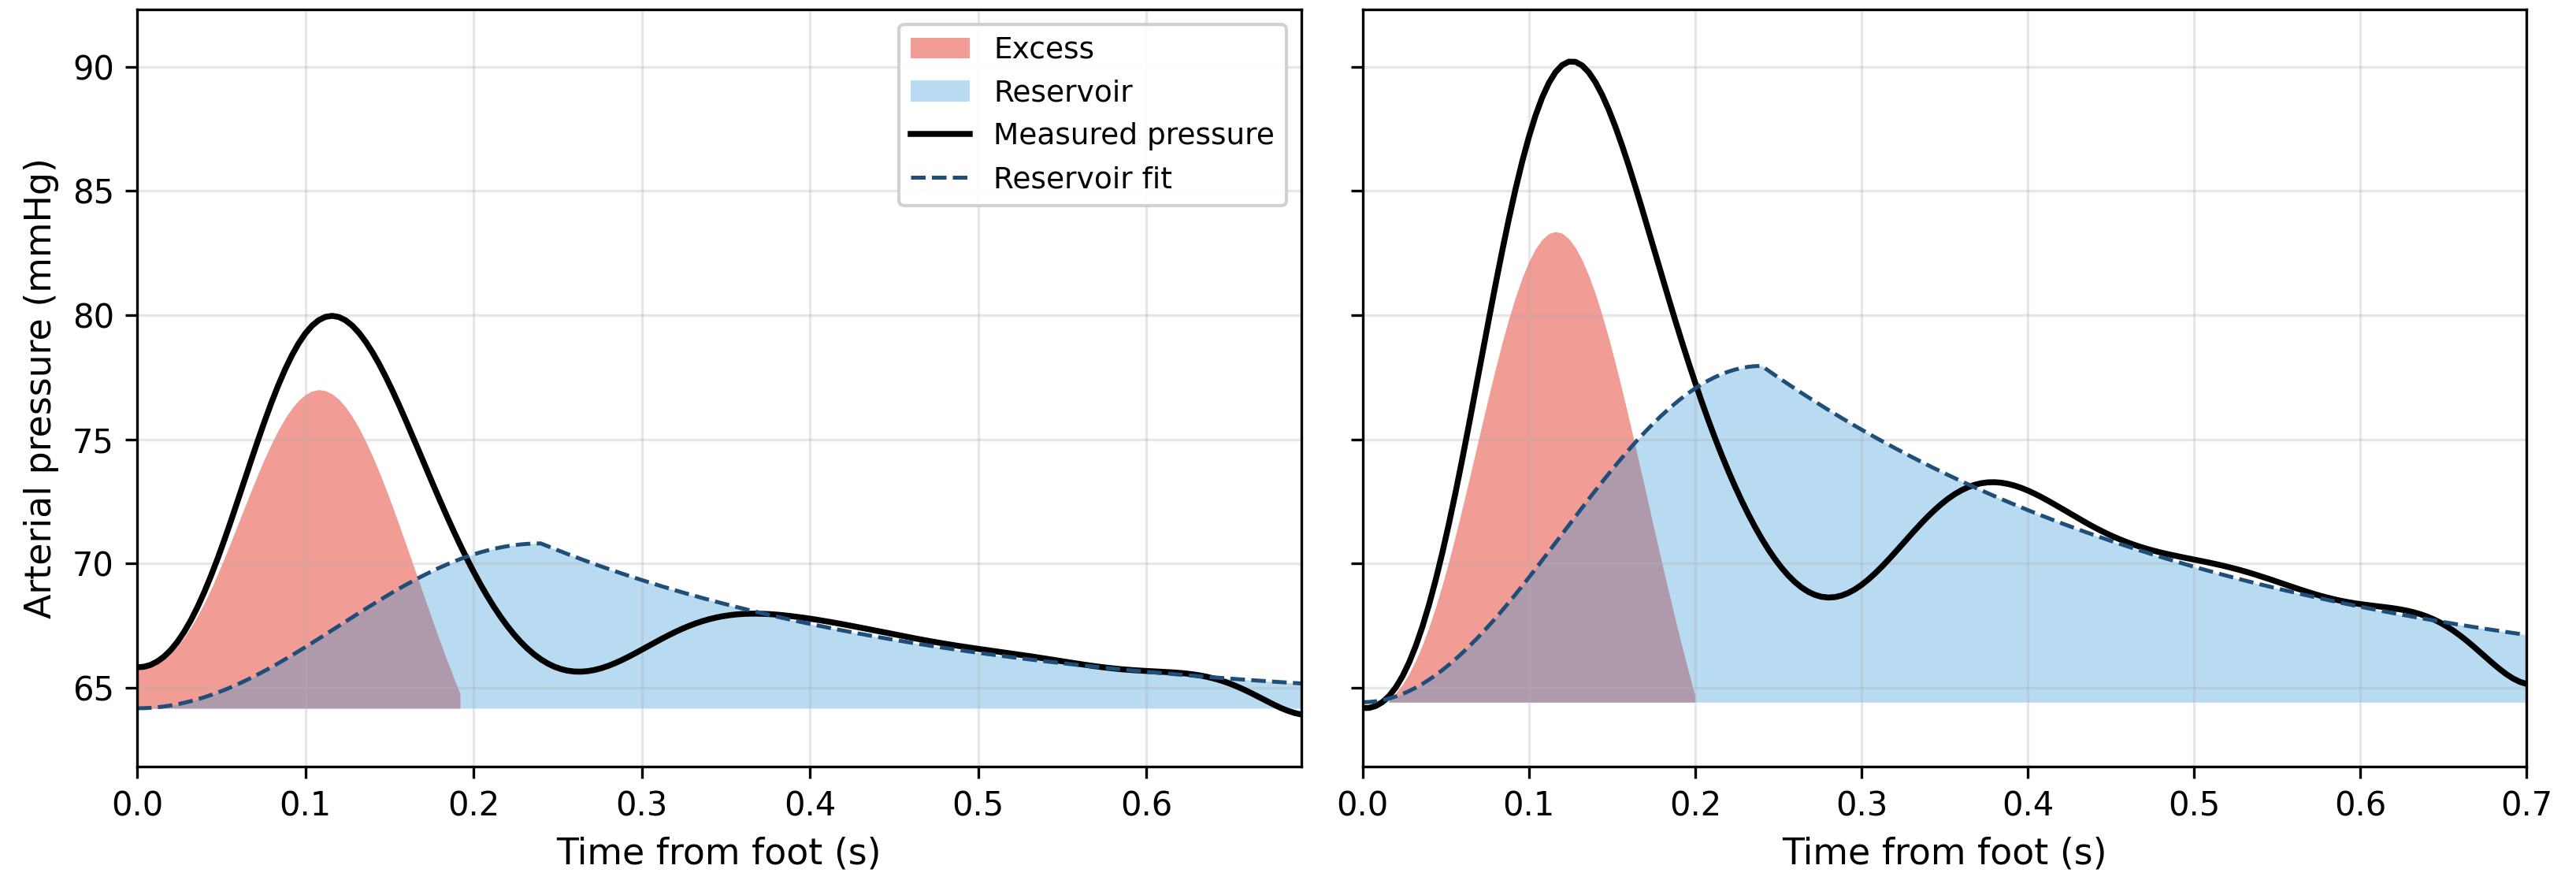
Insights from the Reservoir-Wave Model: Reservoir-wave deconstruction revealed three fundamental insights: (1) Ventilation-induced PPV: The marked baseline PPV was coupled to prominent cyclic variations in excess pressure (Pe, CV 35%) and forward compression wave (FCW) energy, confirming that native stroke volume variation on the steep ascending limb of the Frank-Starling curve was the primary mechanism rather than irreversible pump failure. (2) Preload recruitment over afterload: Volume expansion produced an 8.2-fold surge in peak Pe (1.9 → 15.4 mmHg) with minimal change in reservoir pressure (Pres), while the wave reflection ratio remained invariant (0.245 vs 0.231)—proving the hemodynamic gain was driven by recruitment via the Frank-Starling mechanism rather than altered peripheral wave reflection. (3) The Windkessel “DC offset”: Continuous retrograde cannula flow (Qecmo) acts as a constant current source, establishing an effective asymptotic pressure (Peff_∞ = P∞ + R·Qecmo) that explains the flattened diastolic decay and shortened diastolic time constant (τd = 0.26 s) from reduced arterial compliance.

Subsequent investigation revealed an acute hemoglobin drop from 112 to 78 g/L and a left hemothorax on chest radiograph. Emergent selective catheter angiography identified active bleeding from an intercostal artery (injured during resuscitation), which was successfully treated with transcatheter coil embolization. The patient achieved rapid hemodynamic stabilization and was successfully liberated from VA ECMO on Day 5. Subsequent clinical genetic testing confirmed an underlying pathogenic FLNC (filamin C) cardiomyopathy.

Bedside Telemetry Comparison Brachial A-Line

VA ECMO Flow: 4.6 L/min
Norepinephrine: 0.12 mcg/kg/min
Ventilator VT: 430 mL (6 mL/kg)
Baseline BP (mmHg): 64 / 62 (MAP 62.6 ± 0.6)
Post-Fluid BP (mmHg): 85 / 65 (MAP 70.5 ± 1.8)
Pulse Pressure: 2.5 ± 1.5 → 20.1 ± 3.5 mmHg (8.0×)
ETCO2 Response: 1.9 → 2.7 kPa (+42%)
Peak Pe (Excess Pressure): 1.9 ± 0.7 → 15.4 ± 2.1 mmHg (8.2×)
Peak FCW Wave Intensity: 746 → 59,174 mmHg²·s−¹ (79×)
Wave Reflection Ratio: 0.245 → 0.231
Underlying Etiology: Intercostal Bleed / FLNC
Clinical Liberation: Day 5 Weaned & Decannulated

Three Physiological Insights From Pressure Waveform

  1. Ventilation-Induced PPV Mechanism: Respiratory pulse pressure variation during mechanical ventilation was intimately coupled to beat-to-beat variation in excess pressure (Pe) and forward compression wave energy (FCW), confirming native left ventricular stroke volume variation as the governing physiological mechanism.
  2. Preload Recruitment vs. Afterload: The 8-fold widening in pulse pressure following fluid loading was driven by a disproportionately greater rise in excess pressure over reservoir pressure (peak Pe rose 8.22× while Pres rose only 1.17×), confirming recruitment of Frank-Starling inotropy without changes in systemic wave reflectance (reflection ratio unchanged: 0.245 vs 0.231).
  3. The VA ECMO Windkessel DC Offset: The systemic arterial system adheres strictly to the Windkessel model during mechanical support, but continuous retrograde ECMO cannula delivery functions as a constant current source producing an asymptotic “DC offset” (Peff_∞ = P∞ + R·Qecmo) that explains the flat diastolic decay and preserves perfusion.

Baseline vs. Post-Fluid Reservoir-Wave Decomposition

Direct comparison of the raw Philips IntelliVue monitor screens, 250-Hz extracted arterial traces, and beat-to-beat Pres / Pe separation.

Figure (a): Baseline Hemodynamics & Severe PPV

Severe positive-pressure ventilation-induced PPV and occult hypovolemia on VA ECMO (4.6 L/min)
BASELINE: PP 2.5 ± 1.5 mmHg
Philips IntelliVue monitor at baseline showing narrow PP and PPV
1. Bedside Monitor (25 mm/s)

Philips IntelliVue bedside monitor display. Systemic blood pressure is 64/62 mmHg (MAP 62.6 mmHg) with severe PPV synchronized with positive-pressure mechanical ventilation (VT 430 mL). Low CVP and low ETCO2 (1.9 kPa).

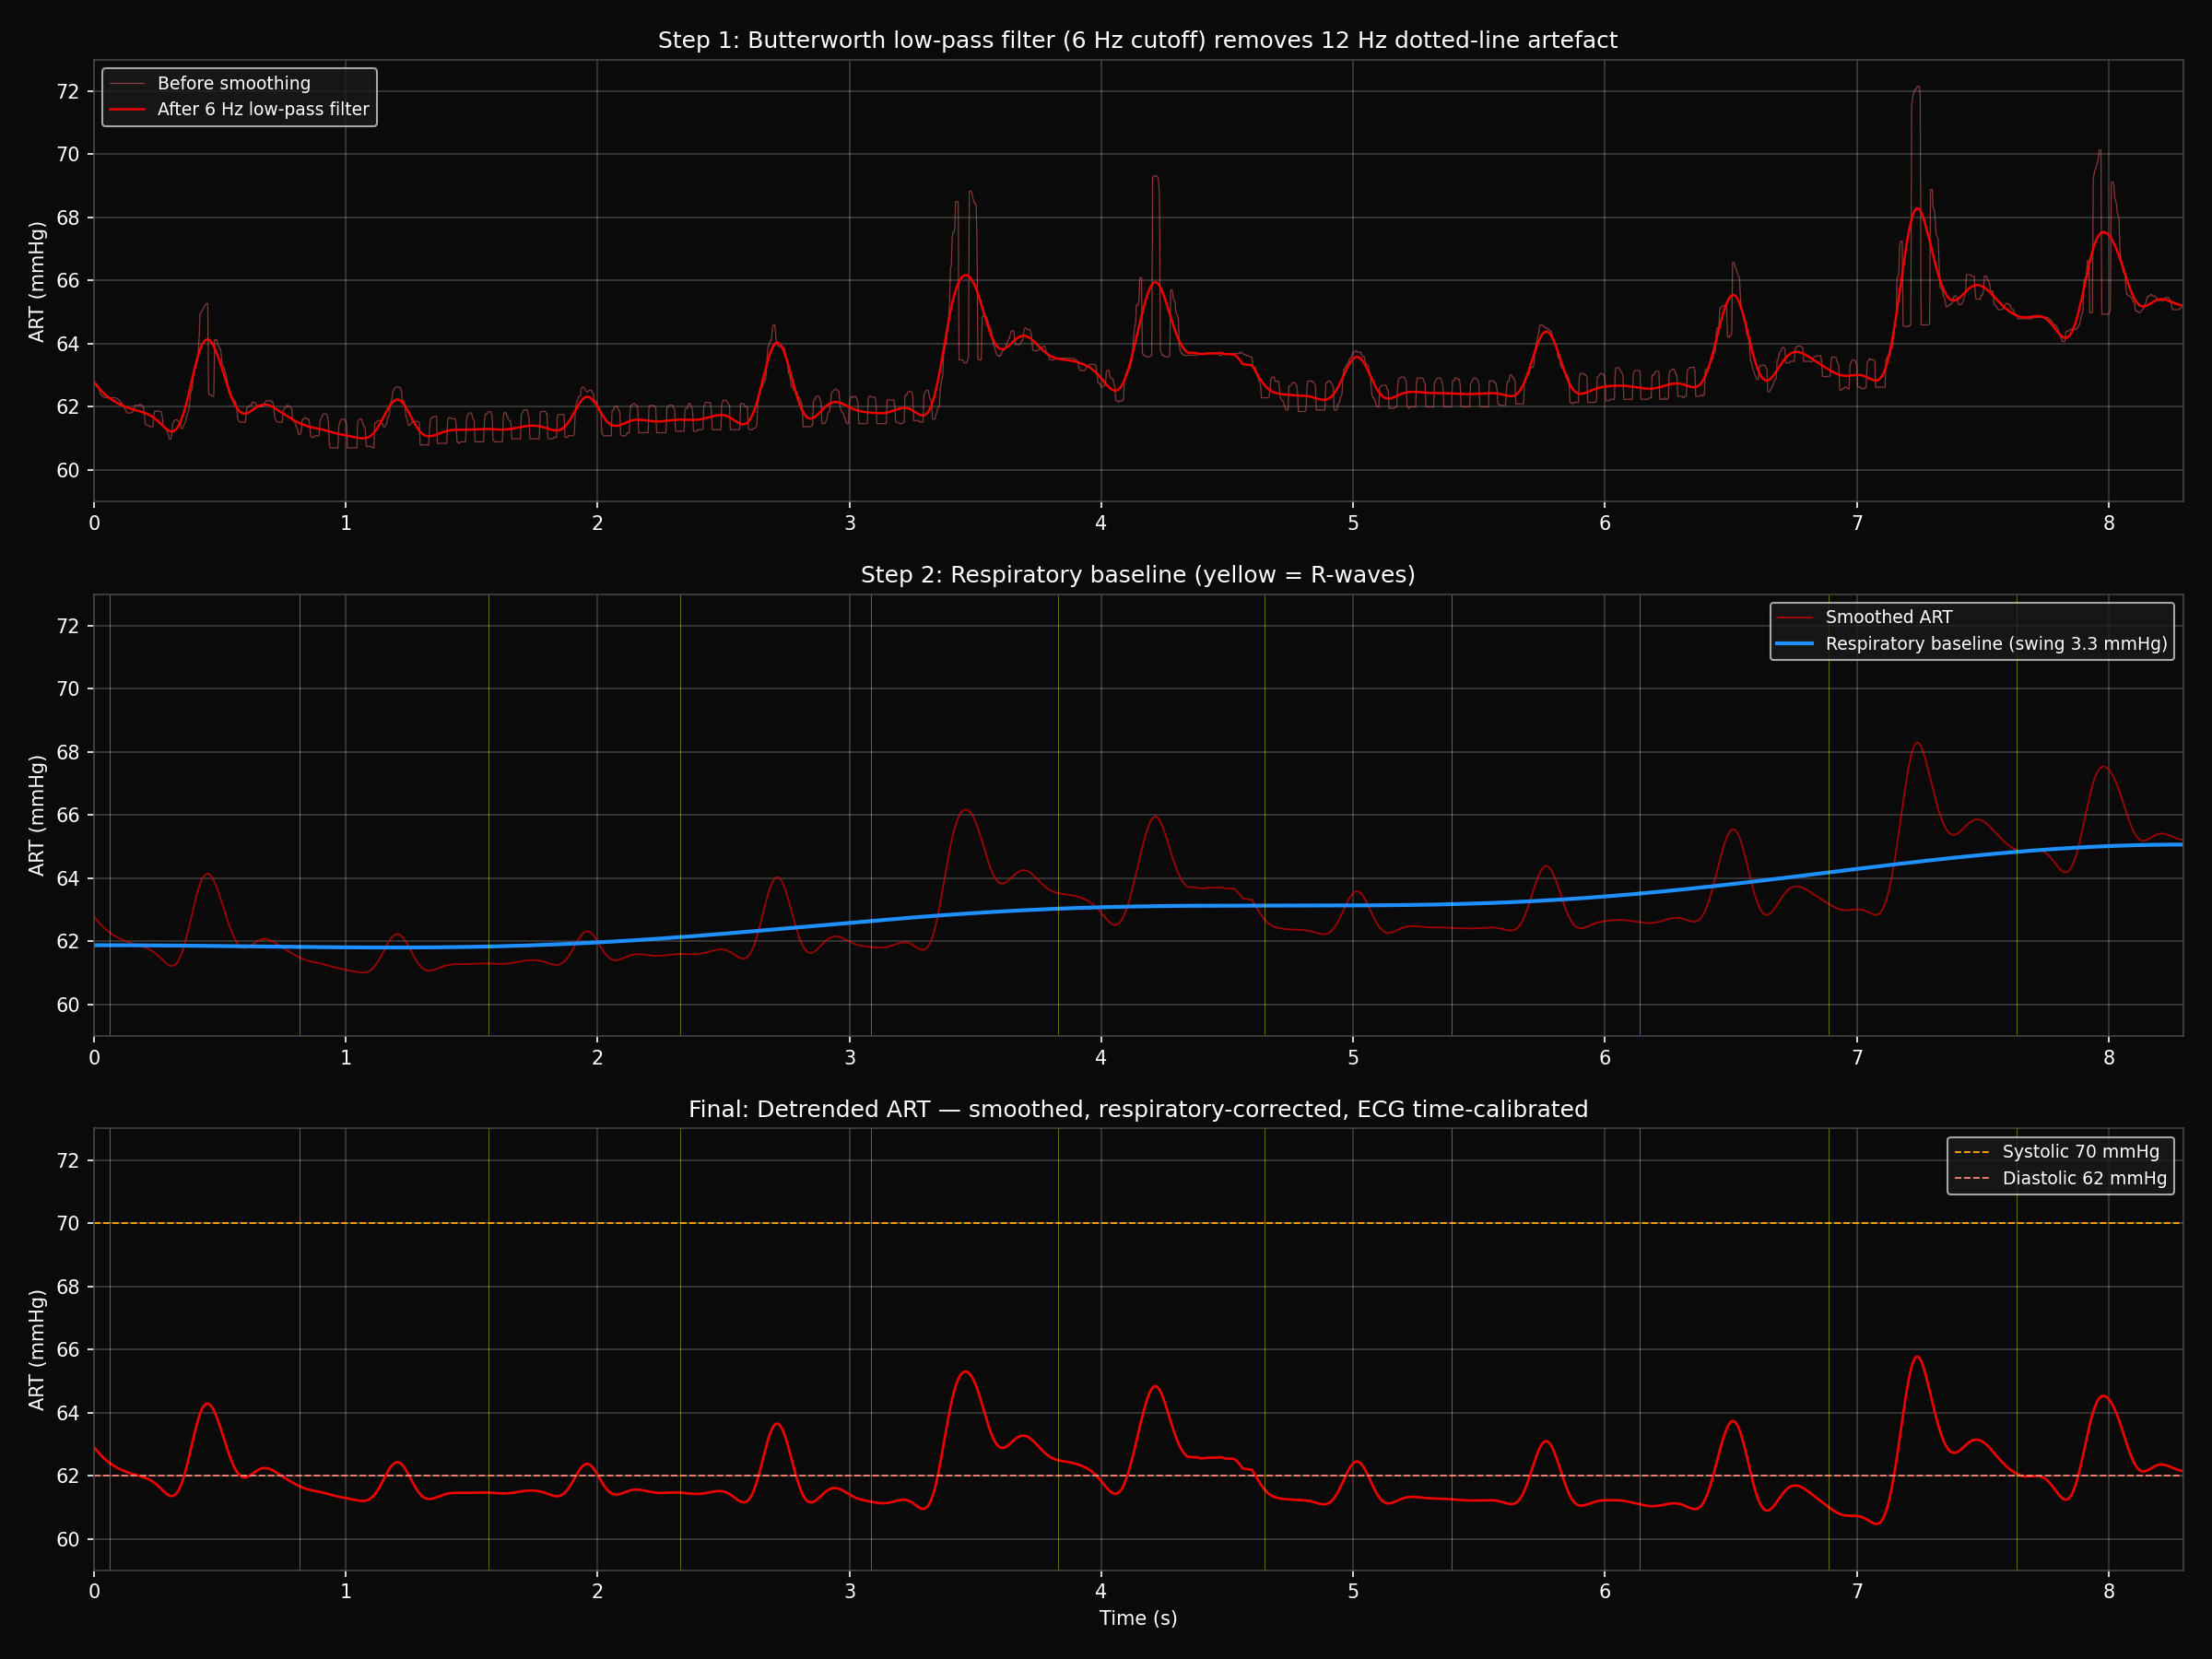
Extracted 250-Hz brachial pressure trace with 6-Hz filtering
2. Extracted Signal

Continuous pressure waveform extracted at 250 Hz. The fundamental cardiac frequency was preserved.

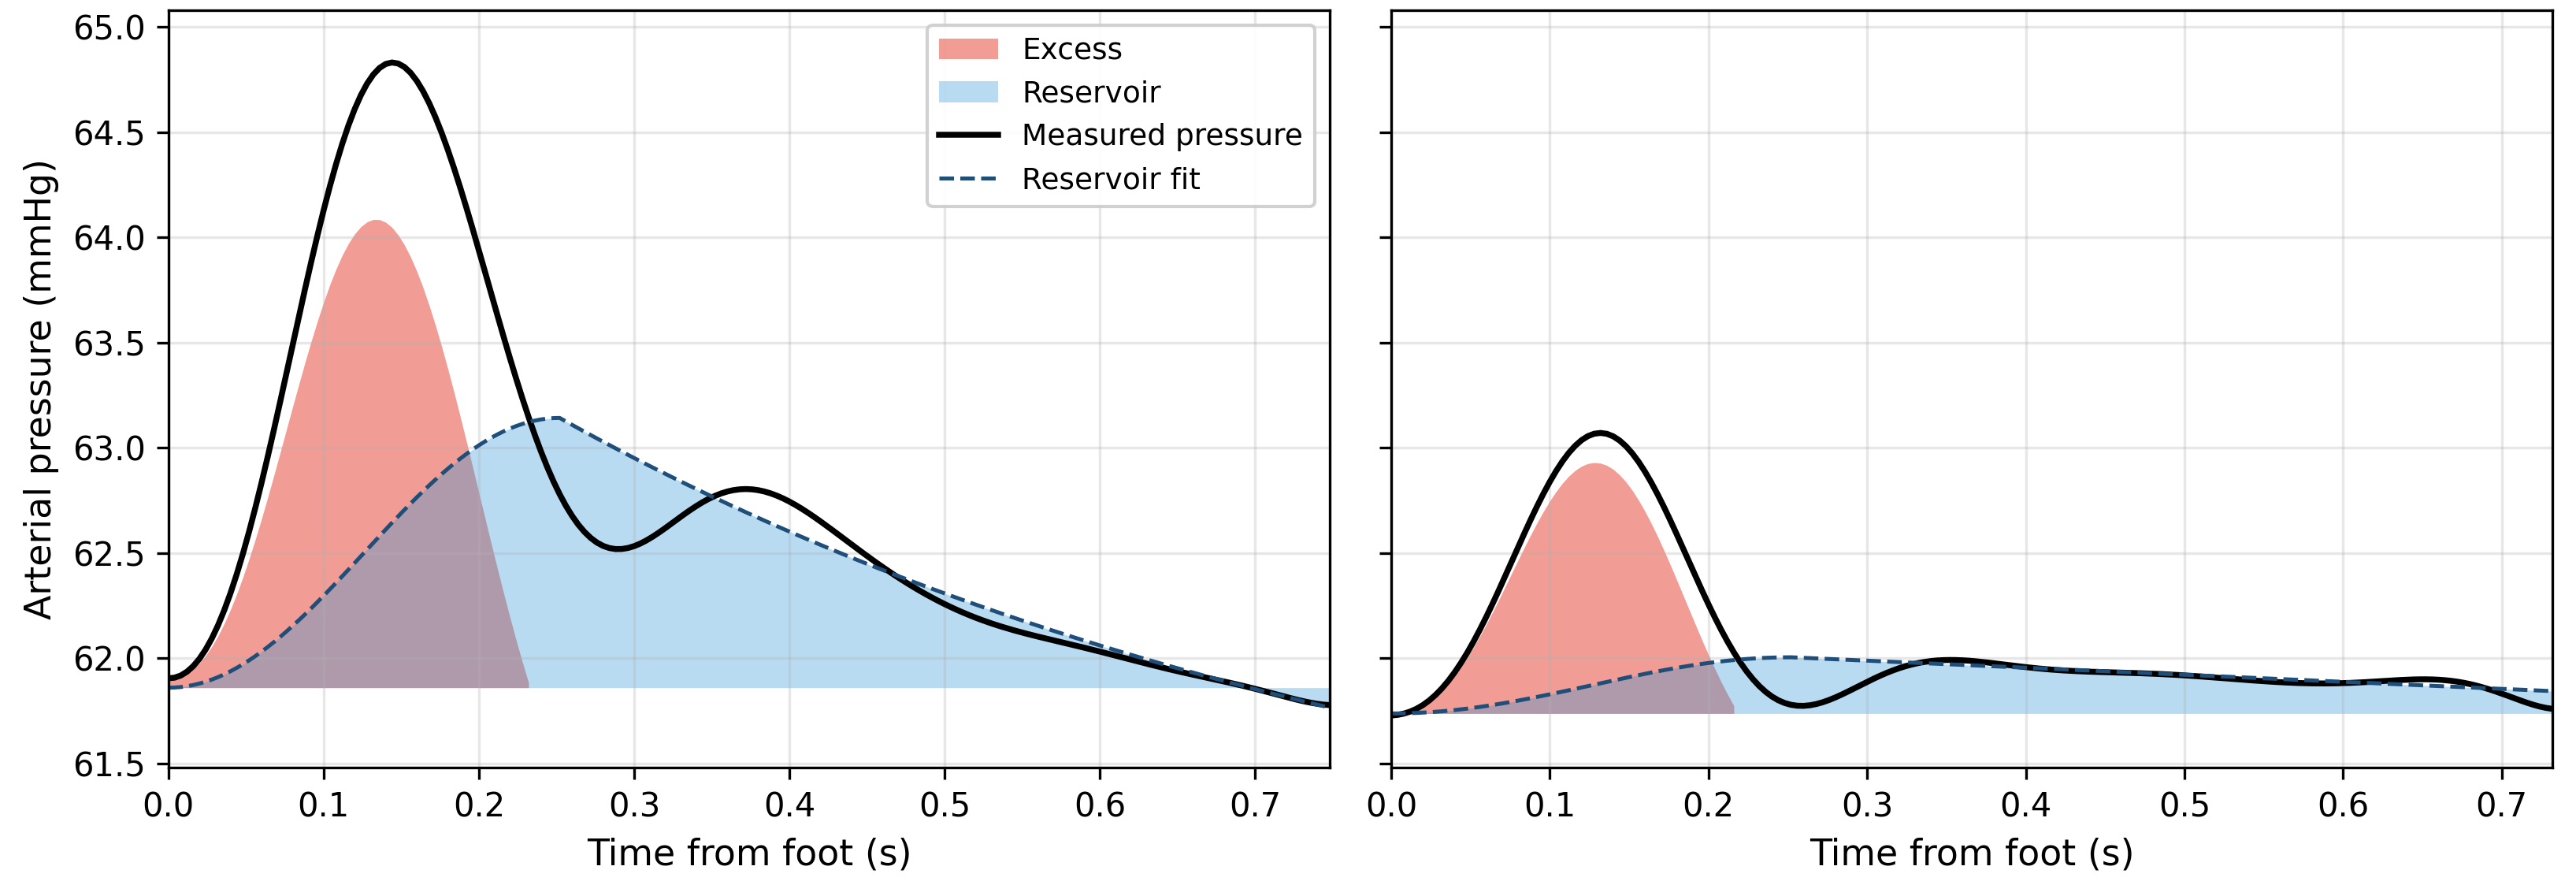
Baseline reservoir and excess pressure decomposition
3. Reservoir-Wave Separation

Beat-to-beat separation of measured pressure (black) into reservoir pressure (Pres, blue) and excess pressure (Pe, red). Note the profound collapse and respiratory variability in Pe (peak 1.9 ± 0.7 mmHg, CV 35%).

Figure (b): Post-Fluid Administration Restoration

Expansion of pulse pressure, surge in native ejection, and abolition of respiratory PPV
POST-FLUID: PP 20.1 ± 3.5 mmHg (8.0×)
Philips IntelliVue monitor post-fluid challenge
1. Bedside Monitor Post-Fluid

Following 1 unit PRBC + 500 mL Hartmann’s solution: Arterial BP rises to 85/65 mmHg (MAP 70.5 mmHg), PP expands to 20.1 mmHg, CVP increases, ETCO2 rises to 2.7 kPa, and respiratory PPV is markedly attenuated.

Extracted 250-Hz brachial pressure trace with 10-Hz filtering
2. Extracted Signal (10-Hz Filter)

Higher signal-to-noise ratio, the sharp systolic upstroke, incisura, and dicrotic notch captured with pristine physiological detail.

Post-fluid reservoir and excess pressure decomposition
3. Reservoir-Wave Separation

Dramatic 8.2-fold surge in peak excess pressure (Pe = 15.4 ± 2.1 mmHg) and 7.2-fold surge in integrated ∫Pe dt (1.63 ± 0.22 mmHg·s), proving recruitment of native LV stroke volume on the Frank-Starling curve.

Hemodynamic & Reservoir-Wave Indices (Baseline vs. Post-Fluid)

Descriptive analysis of consecutive beats across baseline (n = 10) and post-fluid challenge (n = 9). Coefficients of variation (CV) quantify the dramatic collapse in beat-to-beat respiratory instability.

Data Table: Haemodynamic and Reservoir-Wave Indices

Values expressed as Mean ± Standard Deviation (CV %) across analysed cardiac cycles (n = 10 baseline vs. n = 9 post-fluid).

Expand Data Table
Hemodynamic Parameter Baseline (n = 10 beats) Post-Fluid (n = 9 beats) Fold Change Physiological Interpretation
1. Standard Bedside Hemodynamics
Heart Rate (bpm) 81.1 ± 3.3 (CV 4%) 85.6 ± 1.4 (CV 2%) 1.06× Autonomic stability; minimal chronotropic drift
Systolic BP (mmHg) 64.2 ± 1.2 (CV 2%) 84.5 ± 3.7 (CV 4%) 1.32× (+32%) Augmented left ventricular systolic peak pressure
Diastolic BP (mmHg) 61.6 ± 0.3 (CV 1%) 64.5 ± 0.6 (CV 1%) 1.05× Mild elevation governed by constant ECMO circuit inflow
Mean Arterial Pressure (mmHg) 62.6 ± 0.6 (CV 1%) 70.5 ± 1.8 (CV 3%) 1.13× (+13%) Unremarkable MAP rise masking dramatic pulsatile recruitment
Pulse Pressure (mmHg) 2.5 ± 1.5 (CV 58%) 20.1 ± 3.5 (CV 17%) 7.95× Eight-fold expansion in pulse pressure; CV plunges from 58% to 17%
2. Peak Pressure & Wave Separation Indices
Peak Excess Pressure, Pe (mmHg) 1.9 ± 0.7 (CV 35%) 15.4 ± 2.1 (CV 13%) 8.22× Order-of-magnitude surge in native LV forward ejection pressure
Peak Reservoir Pressure, Pres (mmHg) 63.0 ± 1.0 (CV 2%) 74.0 ± 3.1 (CV 4%) 1.17× Moderate expansion of cyclical arterial reservoir volume storage
Peak (Pres − DBP) (mmHg) 1.4 ± 1.3 (CV 89%) 9.5 ± 2.8 (CV 29%) 6.76× Robust expansion of pulsatile reservoir charging above baseline
Peak Ratio: Pe / (Pres − DBP) 2.65 ± 2.00 (CV 75%) 1.68 ± 0.25 (CV 15%) 0.63× Stabilization of the peak wave-to-reservoir partition ratio
Asymptotic Pressure, P∞ (mmHg) 60.2 ± 0.9 (CV 1%) 62.5 ± 0.6 (CV 1%) 1.04× Inflated by VA ECMO constant circuit inflow (DC offset)
3. Primary Integral Indices (Outcome-Relevant Pulsatile Summary)
Integrated Excess Pressure, ∫Pe dt (mmHg·s) 0.23 ± 0.09 (CV 39%) 1.63 ± 0.22 (CV 13%) 7.21× Primary summary index validated in ASCOT-CAFÉ; 7.2-fold rise
Integrated Pulsatile Reservoir, ∫(Pres − DBP) dt (mmHg·s) 0.53 ± 0.53 (CV 99%) 3.24 ± 1.03 (CV 32%) 6.09× Pulsatile reservoir work increases 6-fold with severe CV reduction
Integrated Reservoir Pressure, ∫Pres dt (mmHg·s) 46.2 ± 2.2 (CV 5%) 48.4 ± 1.9 (CV 4%) 1.05× Total mean reservoir volume pressure integral remained stable
Integral Ratio: ∫Pe / ∫(Pres − DBP) 0.83 ± 0.70 (CV 84%) 0.53 ± 0.09 (CV 16%) 0.63× CV collapses from 84% to 16%, reflecting rhythmic reproducibility
Excess Fraction: ∫Pe / [∫Pe + ∫(Pres − DBP)] 0.40 ± 0.17 (CV 43%) 0.34 ± 0.04 (CV 11%) 0.86× Parker hydraulic efficiency: smaller wave fraction, more reservoir storage
4. Windkessel Decay Parameters & Circuit Compliance
Windkessel Decay Rate, λ (s−¹) 3.0 ± 2.4 (CV 80%) 3.8 ± 0.4 (CV 10%) 1.27× Becomes physiologically consistent post-fluid (range 2.7–4.3 s−¹)
Diastolic Time Constant, τd = 1/λ (s) Ill-conditioned* 0.27 ± 0.03 (CV 10%) — Extremely short time constant caused by continuous ECMO pressurisation
5. Wave Intensity Analysis (WIA) & Wave Reflection Indices
Peak FCW Wave Intensity (mmHg²·s−¹) 746 ± 542 (CV 73%) 59,174 ± 21,427 (CV 36%) 79.3× Massive 79-fold surge in forward compression wave peak power
Forward Compression Wave (FCW) Energy (mmHg²) 49.1 ± 37.3 (CV 76%) 3,301 ± 1,177 (CV 36%) 67.2× Proves native myocardial inotropic recruitment on Frank-Starling curve
Backward Compression Wave (|BCW|) Energy (mmHg²) 3.4 ± 3.8 (CV 112%) 154 ± 65 (CV 42%) 45.3× Proportional reflection of the amplified forward wave at impedance sites
Forward Expansion Wave (FEW) Energy (mmHg²) 41.6 ± 23.6 (CV 57%) 2,779 ± 632 (CV 23%) 66.8× Amplified late-systolic proto-diastolic LV relaxation and inertial deceleration
Mean Reflection Ratio (Pb / Pf) 0.245 ± 0.140 (CV 57%) 0.231 ± 0.032 (CV 14%) 0.94× (Unchanged) Crucial proof: Improvement was purely inotropic, NOT altered wave reflection
Wave-Speed Surrogate (κ) 1.14 ± 0.11 (CV 10%) 1.11 ± 0.03 (CV 3%) 0.97× (Unchanged) Sum-of-squares ratio preserved; confirms stable local pressure-flow relation

The Bedside Hemodynamic OODA Loop in This Patient

Physiological insights in compex cases.

Closed-Loop Precision Hemodynamics

Step-by-step clinical decision progression from initial cardiac arrest presentation to successful Day 5 decannulation:

STAGE 01
Observe

Brachial arterial line shows narrow pulse pressure (2.5 ± 1.5 mmHg), dramatic respiratory PPV at VT 430 mL, low CVP, and ETCO2 1.9 kPa on 4.6 L/min VA ECMO. Standard MAP (62.6 mmHg) appears stable, masking impending decompensation.

STAGE 02
Orient (KymoMetrics)

Reservoir-wave separation proves the low PP is driven by collapsed excess pressure (Pe 1.9 mmHg, CV 35%) and extreme respiratory Pe swings. The reflection ratio (0.245) is normal. Orientation: The ventricle is viable but operating on the steep ascending limb of the Frank-Starling curve due to severe hypovolemia.

STAGE 03
Decide

Clinicians avoid blind vasopressor escalation. They execute a controlled fluid challenge (1 unit PRBC + 500 mL Hartmann’s) while strictly holding ECMO flow (4.6 L/min), ventilator settings, and norepinephrine constant. Serial lab tests and imaging are ordered to locate suspected occult bleeding.

STAGE 04
Act & Closed-Loop

Instantaneous confirmation: Peak Pe surges 8.2-fold to 15.4 mmHg, FCW energy jumps 67-fold, ETCO2 rises to 2.7 kPa, and PPV vanishes. Angiography identifies an intercostal artery bleed → coil embolization. Patient is successfully liberated from VA ECMO on Day 5.

Key Scientific References

  1. Lim HS. Pulse pressure variation on veno-arterial extracorporeal membrane oxygenation: insights from reservoir-wave model. Case Report & Biophysical Analysis. University of Birmingham & UHB NHS Foundation Trust, 2024.
  2. Davies JE, Baksi AJ, Francis DP, Hadjiloizou N, Whinnett ZI, Manisty CH, et al. The reservoir-wave approach to arterial hemodynamics: novel insights into the arterial pulse and cardiovascular risk (ASCOT-CAFÉ). J Am Coll Cardiol. 2014.
  3. Parker KH, Wang JJ, Tyberg JV. An alternative approach to arterial hemodynamics: the reservoir-wave model. Med Biol Eng Comput. 2012;50(1):11–24.
  4. Lim HS, et al. The State of the Art in Mechanical Circulatory Support and Hemodynamic Profiling. J Heart Lung Transplant (JHLT). 2024.
  5. European Society of Cardiology. 2026 ESC Consensus Definition and Phenotyping on Cardiogenic Shock. ESC Guidelines, 2026.