
Advanced Hemodynamics:
From Waveforms to Meaning
Decoding the biophysical mechanics hidden inside routine arterial and central venous waveforms. Decoupling vascular capacitance from cardiac wave transmission and right ventricular venous return.
1. The Reservoir-Wave Hypothesis
Resolving systemic arterial pressure into elastic reservoir storage and propagating wave components.
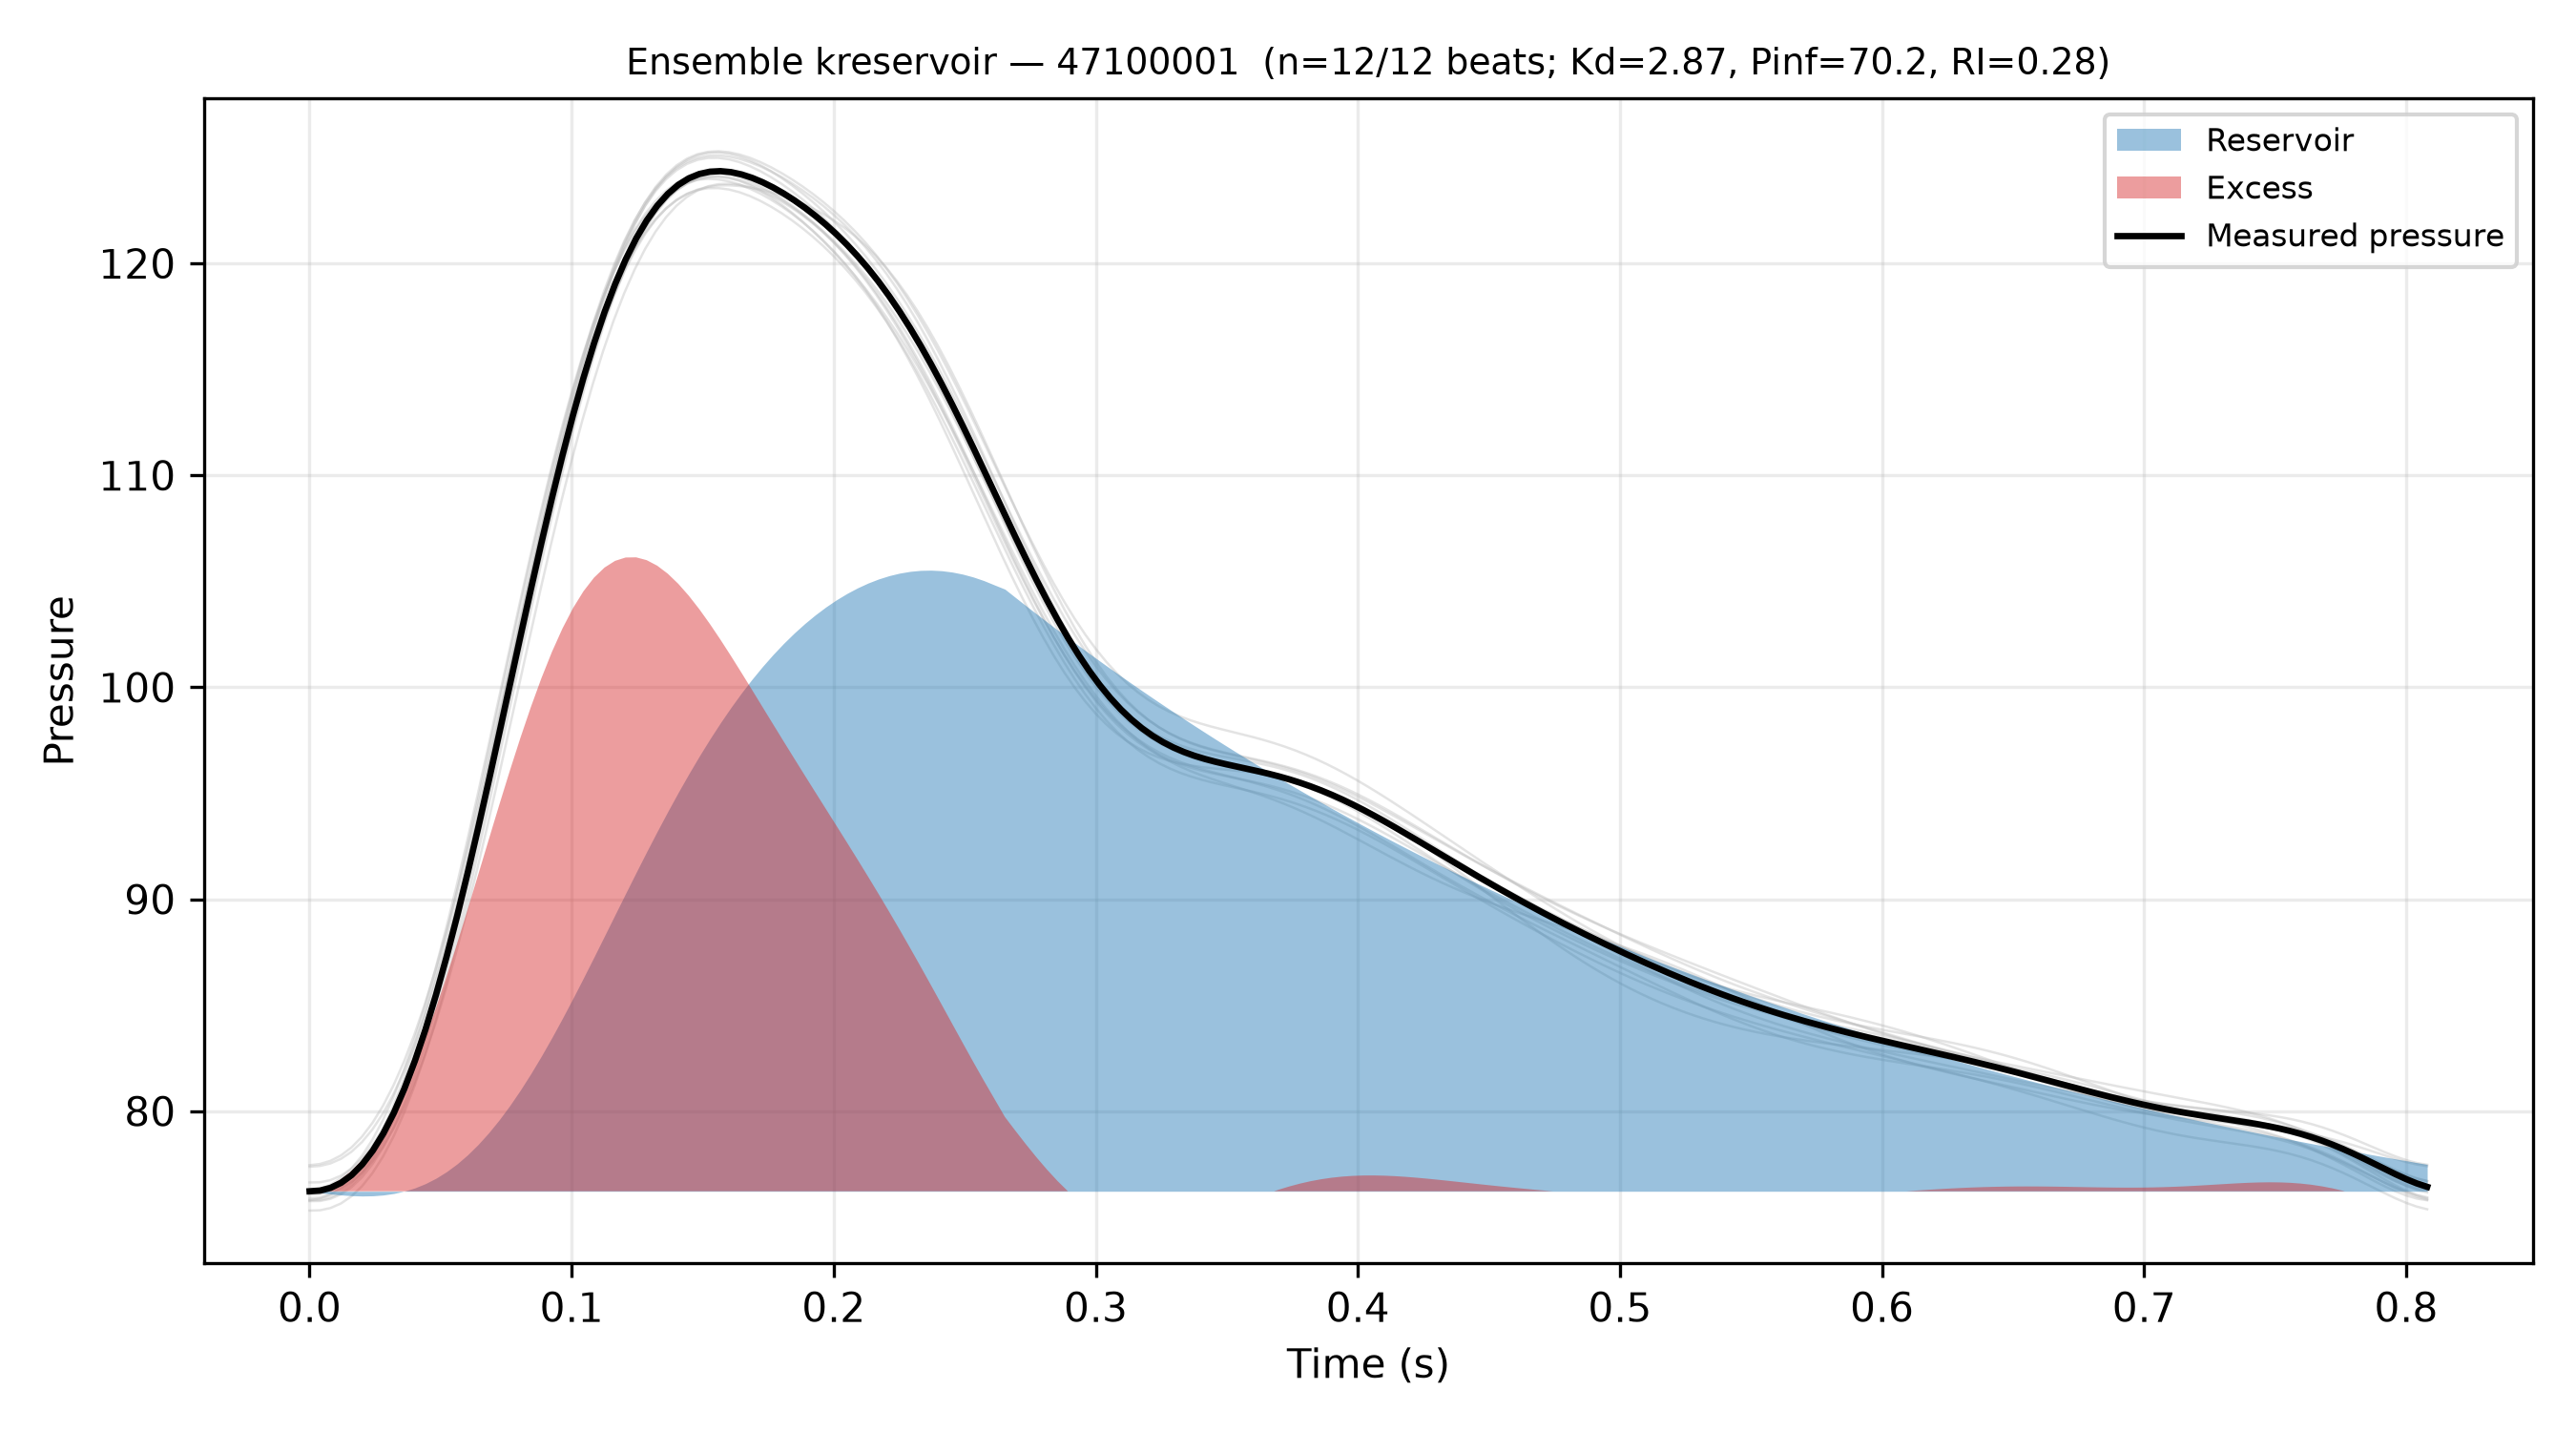
Historically, separating measured blood pressure into forward and backward waves during diastole resulted in self-cancelling, physiologically contradictory waves. The reservoir-wave approach resolves this paradox by recognizing the dual nature of arterial pressure:
Where Pres(t) represents Otto Frank's Windkessel reservoir pressure—uniform throughout the proximal arterial tree—and Pex(x, t) is the dynamic excess pressure driving localized wave propagation.
By fitting the diastolic decay of pressure to an exponential curve governed by the systemic time constant (τ = RC, representing true Windkessel compliance and peripheral resistance), the reservoir component is resolved. Once subtracted, wave energy during diastole drops to zero, aligning with real physical flow.
2. The 3-Element Windkessel Analogue
Connecting compliance, characteristic impedance, and systemic resistance.
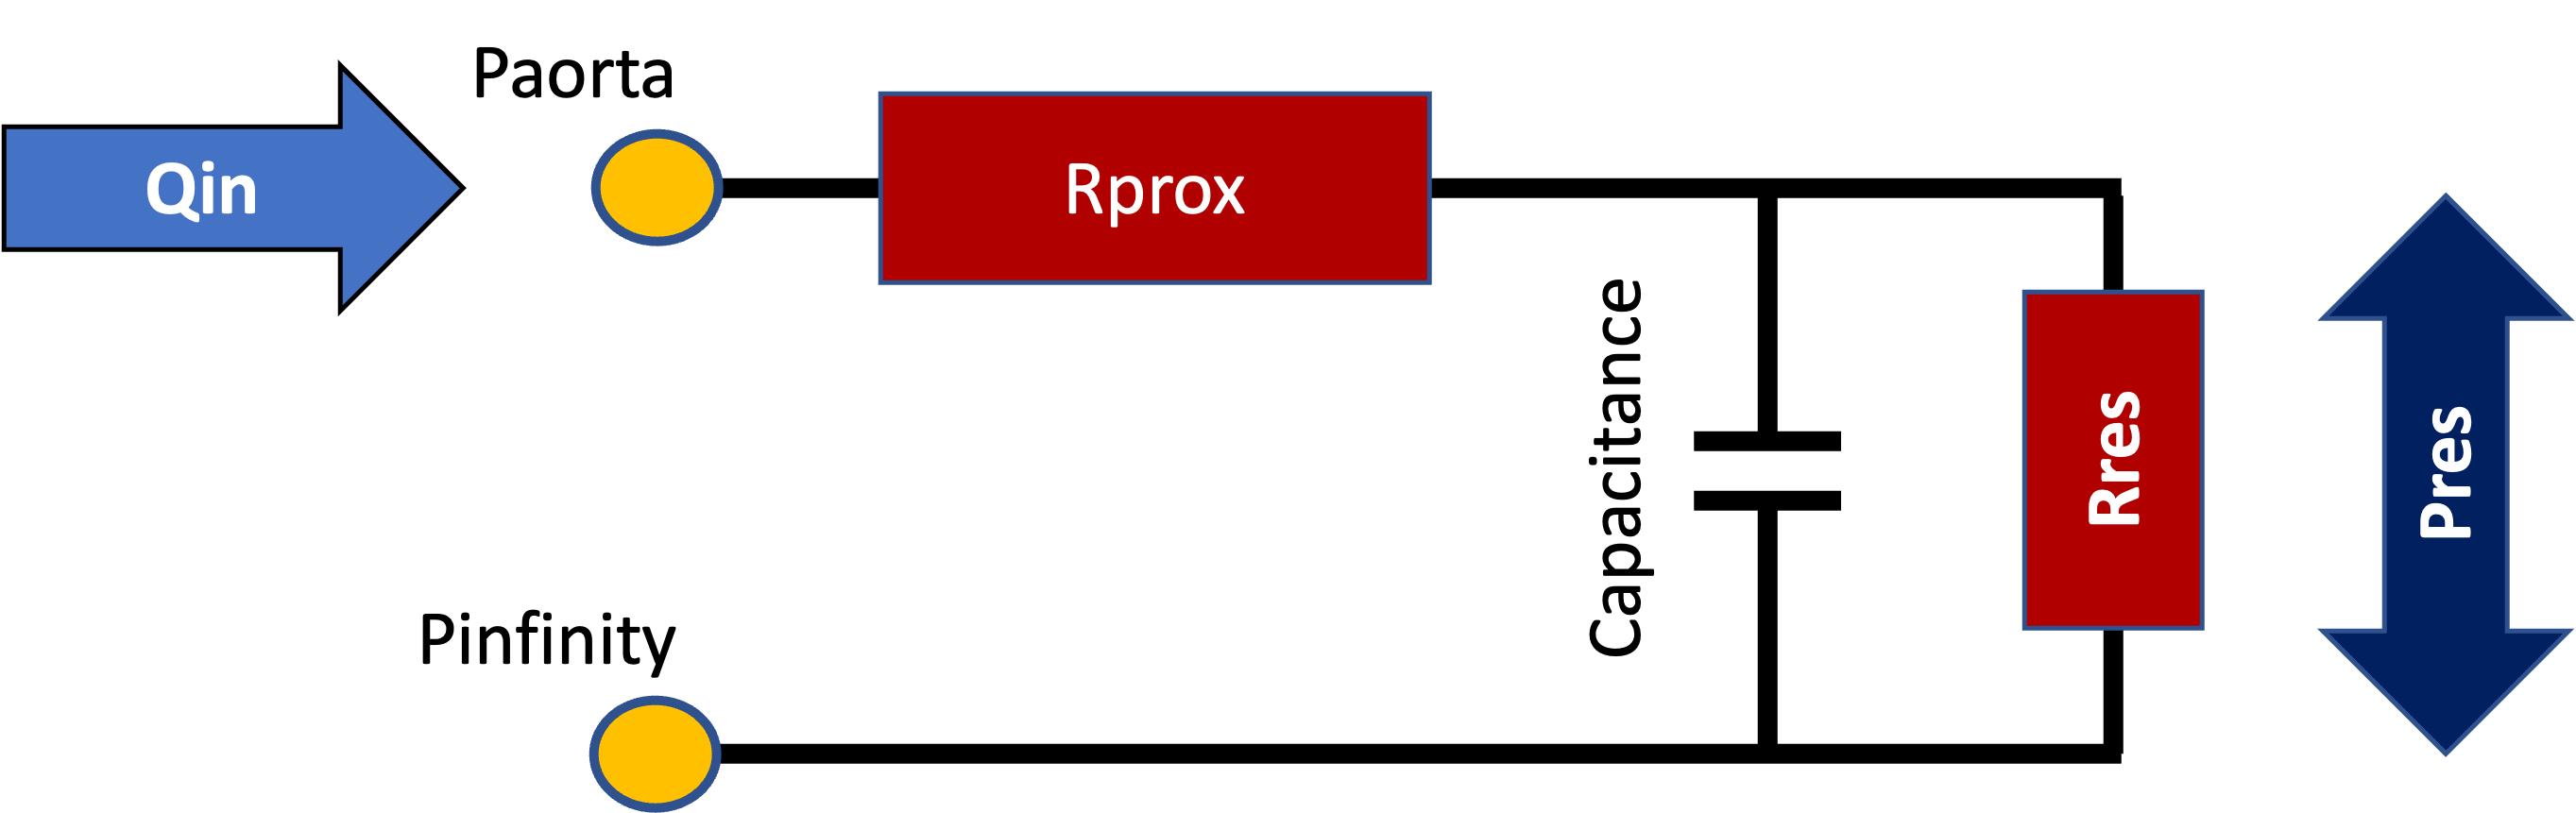
The electrical analogue circuit for the three-element Windkessel (RCR circuit) models the arterial tree as an elastic capacitor and resistive network:
- C (Aortic Compliance): Elastic reservoir storage buffering left ventricular stroke volume.
- Rprox (Characteristic Impedance, Zc): The high-frequency opposition of the proximal aorta before wave reflections arrive.
- Rres (Peripheral Resistance): The systemic vascular resistance of distal arteriolar beds.
KymoMetrics derives independent compliance and resistance values directly from the routine arterial trace—allowing clinicians to differentiate true vasoplegia from reduced arterial compliance in acute shock.
Launch Interactive ESPVR & EDPVR Simulator →3. Central Venous Pressure (CVP) Waveform Dynamics
Transcending static pressure numbers into right atrial cycle morphology and ventricular coupling.
In current ICU practice, central venous pressure is reported as an isolated hydrostatic mean (e.g. CVP = 13 mmHg), discarding the dynamic atrial cardiac cycle.
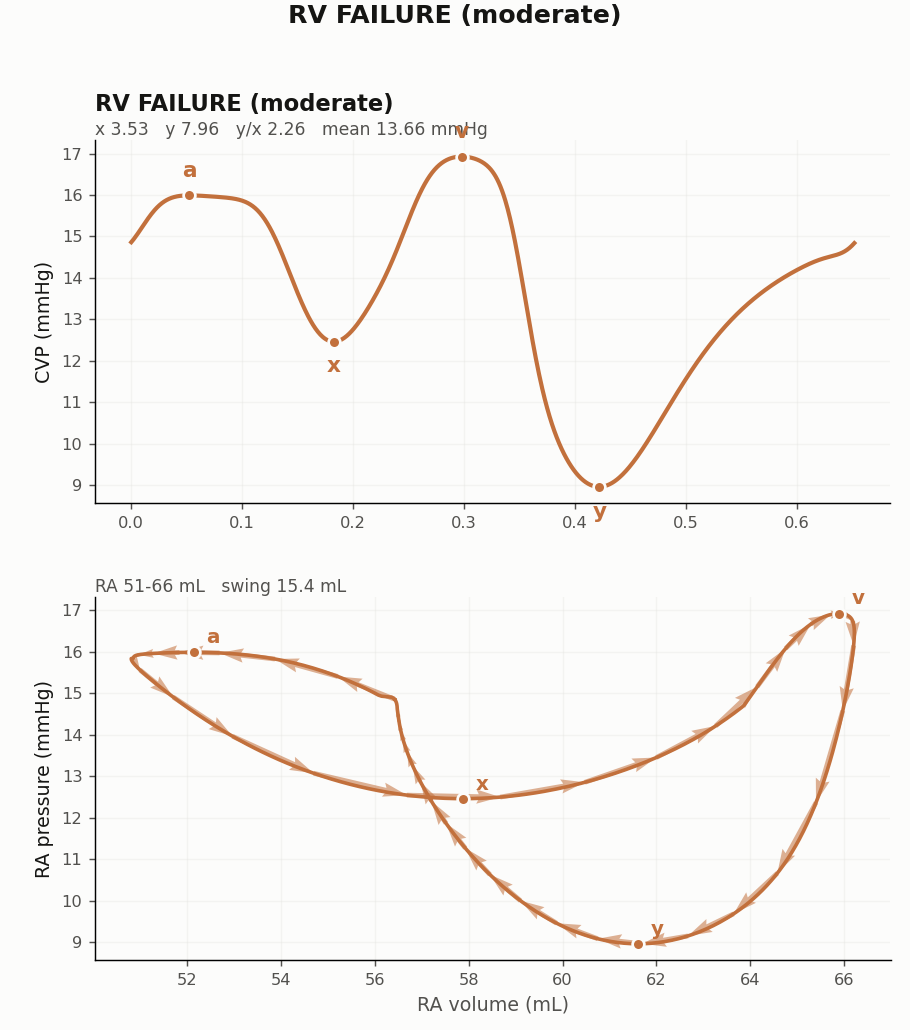
KymoMetrics analyzes the fundamental morphological complexes:
- a wave: Right atrial contraction, indicating end-diastolic right ventricular compliance.
- c wave: Tricuspid valve closure and bulging into the atrium during RV isovolumetric contraction.
- x descent: Atrial relaxation and downward descent of the RV base, reflecting RV systolic shortening.
- v wave & y descent: Venous filling and early diastolic tricuspid opening, directly assessing right heart volume overload and tricuspid regurgitation.
4. Objective Capability Matrix
Comparing conventional bedside monitors, waveform analytics wrappers, and KymoMetrics biophysical intelligence.
| Hemodynamic Dimension | Conventional Bedside Monitors Philips IntelliVue, GE, Mindray |
Waveform Analytics Wrappers Directed Systems, Edwards HPI |
KymoMetrics Engine Physiological Data Science |
|---|---|---|---|
|
Signal Interrogation
Signal depth & extraction
|
✕ Discards 99% of high-frequency data; reports only crude MAP and HR every few seconds. | ● Repackages conventional arterial pressure in statistical wrappers or machine-learning alerts. | ✓ Deconstructs raw waveforms into elastic reservoir pressure (Pres) and excess wave pressure (Pex). |
|
Venous Circulation & CVP
Preload & right heart compliance
|
✕ Reports CVP as an isolated, static numerical mean (e.g. 13 mmHg), ignoring cardiac timing. | ✕ Left-sided systemic arterial trends only; venous dynamics are omitted. | ✓ Extracts a, c, v waves and x, y descents to assess right heart compliance and venous return resistance. |
|
Vascular Afterload
Systemic resistance vs compliance
|
✕ Calculates lumped SVR, conflating steady resistance with dynamic arterial compliance. | ● Uses stroke volume variation (SVV) without isolating elastic storage. | ✓ Isolates true Windkessel compliance (τ = RC), impedance (Zc), and wave reflection intensity (Pb/Pf). |
|
Cardiopulmonary Coupling
Systemic circuit synchrony
|
✕ Arterial and venous numbers are displayed independently with no integration. | ✕ Unilateral systemic focus only; cardiopulmonary loop remains uncoupled. | ✓ Synchronously couples arterial afterload with venous return kinetics for closed-circuit evaluation. |
|
Clinical Guidance
Therapeutic bedside action
|
✕ Reactive alarms after hypotension (MAP < 65) has already occurred. | ● Non-specific risk alerts without identifying physiological cause. | ✓ Cause-specific guidance: hypovolemia vs vasoplegia vs RV strain vs pump failure. |